本文根據 Frank R. Giordano 等人所著 A First Course in Mathematical Modeling 的一個專案,使用 Monte Carlo 方法模擬飛鏢遊戲。
飛鏢模擬
靶面區域及得分如下:
| 飛鏢靶區域 | 分數 |
|---|---|
| 靶心 | 50 |
| 黃環 | 25 |
| 藍環 | 15 |
| 紅環 | 10 |
| 白環 | 5 |
由原點——靶心中心——起計,各環半徑為:
| 環 | 厚度(in.) | 外邊緣距原點(in.) |
|---|---|---|
| 靶心 | 1.0 | 1.0 |
| 黃環 | 1.5 | 2.5 |
| 藍環 | 2.5 | 5.0 |
| 紅環 | 3.0 | 8.0 |
| 白環 | 4.0 | 12.0 |
靶面半徑為 1 ft,即 12 in.。我們需要先假設飛鏢落點的機率分佈,再寫出演算法。運行 1,000 次模擬,估計每局投五支飛鏢的平均得分,並找出期望價值——該環分數乘以命中機率——最高的環。
解法
先匯入所需函式庫並設定繪圖:
import numpy as np
import matplotlib.pyplot as plt

import matplotlib
matplotlib.rcParams.update({'font.family': 'serif', 'font.size': 16})
Monte Carlo 模擬仍應設定隨機種子,令結果可以重現:
np.random.seed(23)定義靶面尺寸與各區分數:
BULLSEYE_RADIUS = 1.0
YELLOW_RADIUS = 2.5
BLUE_RADIUS = 5.0
RED_RADIUS = 8.0
WHITE_RADIUS = 12.0

POINTS = {
    "Bull's eye": 50,
    "Yellow ring": 25,
    "Blue ring": 15,
    "Red ring": 10,
    "White ring": 5,
    "Miss": 0
}
throw_dart 假設水平與垂直誤差互相獨立,並都服從以靶心為平均、標準差為 std_dev 的常態分佈。由此得到的徑向距離服從 Rayleigh 分佈:
def throw_dart(std_dev):
    """Simulate throwing a dart"""
    x = np.random.normal(0, std_dev)
    y = np.random.normal(0, std_dev)
    return x, y, np.sqrt(x**2 + y**2)
按距離決定每一投的得分:
def score_throw(distance):
    """Score a throw based on its distance from the center"""
    if distance <= BULLSEYE_RADIUS:
        return POINTS["Bull's eye"]
    elif distance <= YELLOW_RADIUS:
        return POINTS["Yellow ring"]
    elif distance <= BLUE_RADIUS:
        return POINTS["Blue ring"]
    elif distance <= RED_RADIUS:
        return POINTS["Red ring"]
    elif distance <= WHITE_RADIUS:
        return POINTS["White ring"]
    else:
        return POINTS["Miss"]
接着模擬多局遊戲,同時保存總分、各環命中次數與所有落點:
def run_simulation(num_simulations, num_darts, std_dev):
    """Run the Monte Carlo simulation"""
    total_scores = []
    ring_hits = {ring: 0 for ring in POINTS.keys()}
    all_throws = []

    for _ in range(num_simulations):
        game_score = 0
        for _ in range(num_darts):
            x, y, distance = throw_dart(std_dev)
            score = score_throw(distance)
            game_score += score
            all_throws.append((x, y))

            for ring, radius in zip(
                ["Bull's eye", "Yellow ring", "Blue ring", "Red ring", "White ring"],
                [BULLSEYE_RADIUS, YELLOW_RADIUS, BLUE_RADIUS, RED_RADIUS, WHITE_RADIUS]
            ):
                if distance <= radius:
                    ring_hits[ring] += 1
                    break
            else:
                ring_hits["Miss"] += 1

        total_scores.append(game_score)

    return total_scores, ring_hits, all_throws
繪圖函數同時顯示靶面落點與每局總分直方圖:
def plot_dartboard(all_throws):
    fig, (ax1, ax2) = plt.subplots(1, 2, figsize=(20, 10))

    radii = [BULLSEYE_RADIUS, YELLOW_RADIUS, BLUE_RADIUS, RED_RADIUS, WHITE_RADIUS]
    colors = ['red', 'yellow', 'blue', 'red', 'white']

    for radius, color in zip(radii, colors):
        circle = plt.Circle((0, 0), radius, fill=False, color=color)
        ax1.add_artist(circle)

    x, y = zip(*all_throws)
    ax1.set_facecolor('black')
    ax1.scatter(x, y, color='green', s=1, alpha=0.8)
    ax1.set_xlim(-12.5, 12.5)
    ax1.set_ylim(-12.5, 12.5)
    ax1.set_aspect('equal')
    ax1.legend(["Bull's eye", "Yellow ring", "Blue ring", "Red ring", "White ring"])
    ax1.set_title("Simulated Dart Throws")

    ax2.hist(scores, bins=30, edgecolor='black')
    ax2.set_title(f"Distribution of Scores for {num_darts} Darts")
    ax2.set_xlabel("Score")
    ax2.set_ylabel("Frequency")

    plt.tight_layout()
    plt.show()
運行 1,000 局,每局五支飛鏢,並取落點座標標準差為 3 in.:
num_simulations = 1000
num_darts = 5
std_dev = 3

scores, ring_hits, all_throws = run_simulation(
    num_simulations, num_darts, std_dev
)
計算平均總分、各環命中機率與每環對單支飛鏢期望分數的貢獻:
mean_score = np.mean(scores)
total_throws = num_simulations * num_darts

print(f"Mean score for {num_darts} darts: {mean_score:.2f}")
print("\nProbability of hitting each ring:")
for ring, hits in ring_hits.items():
    prob = hits / total_throws
    expected_value = POINTS[ring] * prob
    print(f"{ring}: {prob:.4f} (Expected value: {expected_value:.2f})")
這個固定種子運行得到:
Mean score for 5 darts: 89.45

Bull's eye: 0.0566 (Expected value: 2.83)
Yellow ring: 0.2302 (Expected value: 5.75)
Blue ring: 0.4632 (Expected value: 6.95)
Red ring: 0.2220 (Expected value: 2.22)
White ring: 0.0274 (Expected value: 0.14)
Miss: 0.0006 (Expected value: 0.00)
找出期望貢獻最高的環:
best_ring = max(
    ring_hits.keys(),
    key=lambda x: POINTS[x] * ring_hits[x] / total_throws
)
print(f"\nRing with highest expected value: {best_ring}")
輸出為:
Ring with highest expected value: Blue ring最後繪圖:
plot_dartboard(all_throws)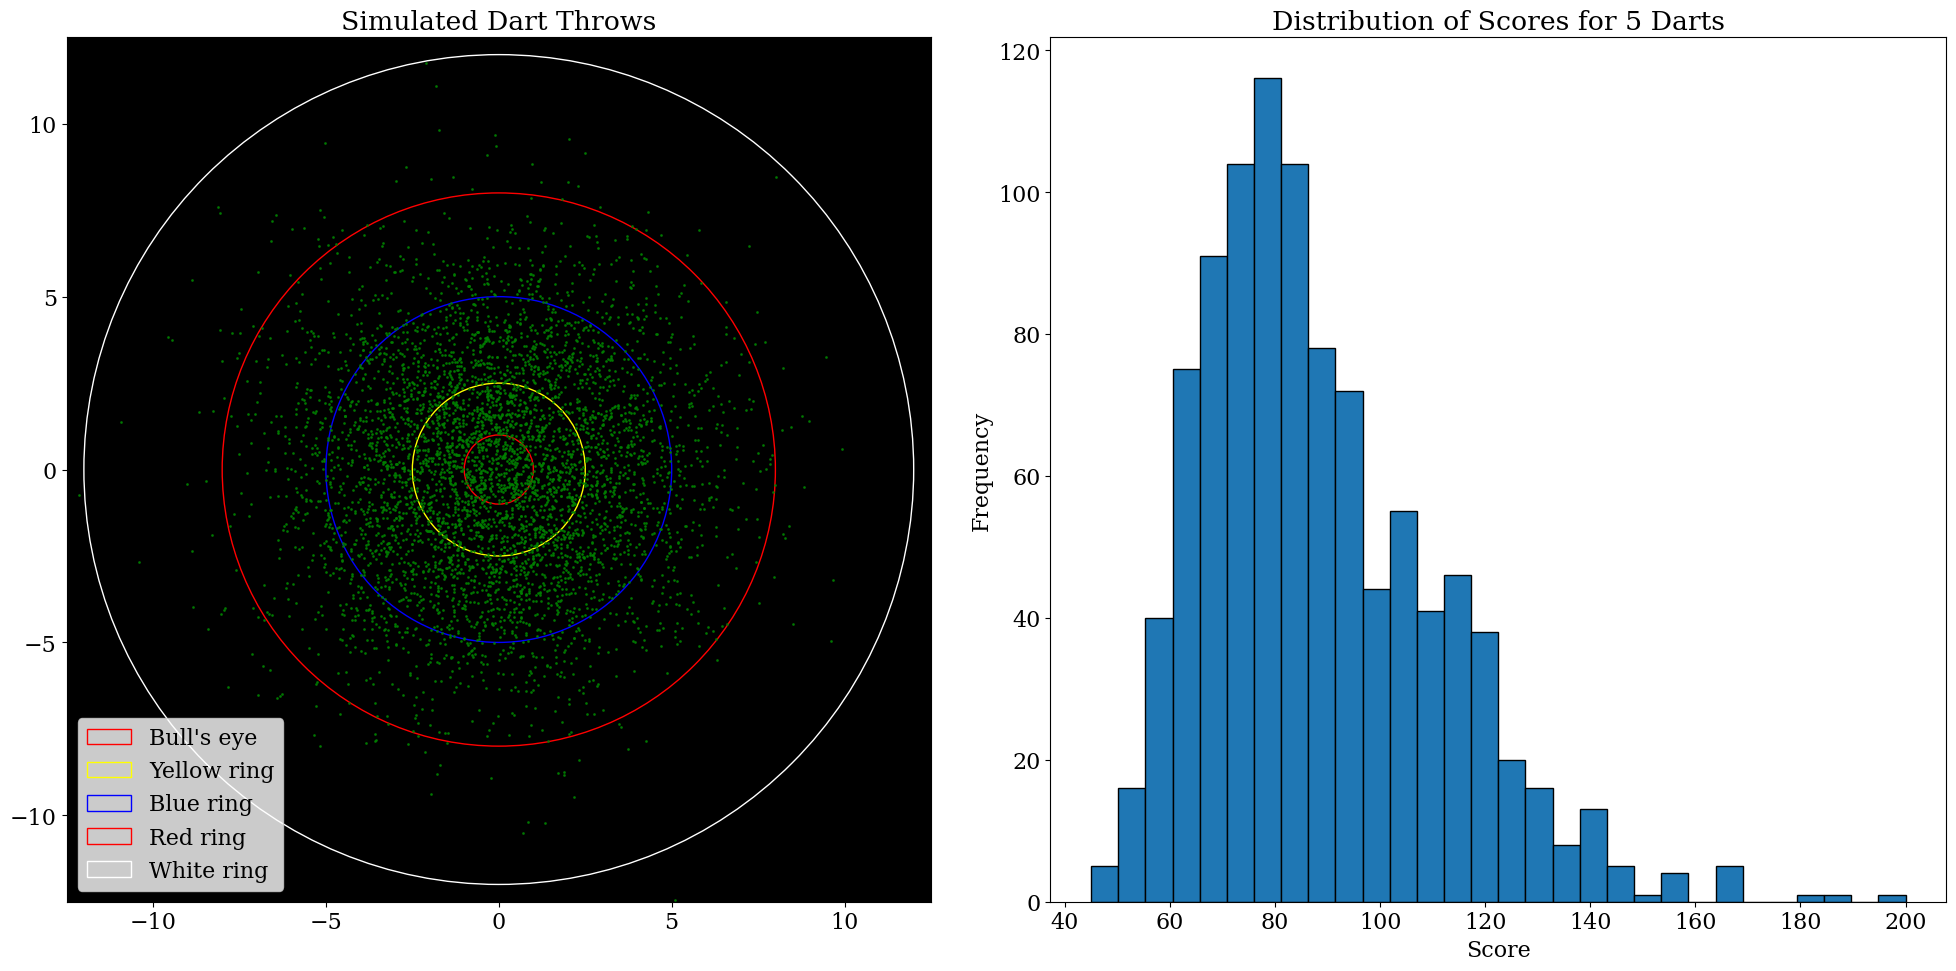
結果與討論
在 std_dev = 3 的指定二維常態模型與固定種子下,五支飛鏢平均總分為 。各區結果為:
- 靶心:,期望貢獻
- 黃環:,期望貢獻
- 藍環:,期望貢獻
- 紅環:,期望貢獻
- 白環:,期望貢獻
- 脫靶:,期望貢獻
藍環的單支飛鏢期望分數貢獻最高,圖中的落點亦大多位於藍環。
這些數值不是飛鏢遊戲的一般規律,而是落點分佈、標準差、靶面尺寸及模擬種子共同產生的結果。若選手存在系統偏差、水平與垂直誤差不同,或投擲之間相依,結果會改變。
結語
本文以 Monte Carlo 方法模擬飛鏢得分,示範如何由一個明確機率模型估計平均總分、命中機率及期望貢獻。更有研究價值的下一步,是用實際落點資料估計分佈,再比較常態模型與帶偏差、重尾或學習效應的替代模型。