
Editorial overview
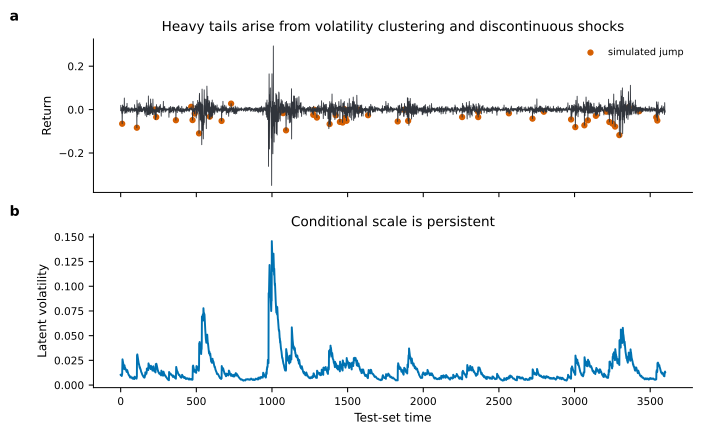
Read How Much Tail Risk Does a Gaussian Model Hide? for the stress process, diagnostics, VaR and ES forecasts, backtests, calibration, tail-risk surface, uncertainty, sharpness frontier, and nine approved figures.
The public page interprets reviewed evidence without exposing private code, fitted arrays, notebooks, or intermediate calculations.
Key findings
- Filtered historical simulation is closest to the nominal 1% exception rate at 0.00972.
- The fitted Student-t GARCH degrees of freedom is 4.2685, indicating materially heavy innovations.
Limitations
- The returns are synthetic and the results are not investment advice.
- Multivariate dependence, liquidity, transaction costs, and structural breaks are outside scope.
Technical record
Detailed source, calculations, generated figures, and reproduction instructions are maintained in a private technical workspace. Public articles contain only manually reviewed interpretation and approved figures.
Version history
2026-08-02 — Curated overview reviewed against repository evidence.