More data usually reduce uncertainty. They do not automatically reduce model error.
That distinction matters in phylogenetics because sequence analysis never converts nucleotides into a tree without assumptions. A distance formula decides how observed differences represent evolutionary change. A reconstruction algorithm then decides which topology best matches those distances. If the distance model cannot represent the process that generated the sequences, longer alignments may estimate the wrong population-level distances with increasing precision.
This project constructs a four-taxon experiment where that failure is visible. The true unrooted split is
Taxa (A) and (C) are not sisters, but the heterogeneous scenario drives their nucleotide compositions toward similar targets on long branches. The study asks whether p-distance, JC69, K80, and a regularized log-det distance recover the true split as sequence length increases.
The data-generating process
Sequence evolution is simulated as a continuous-time Markov chain. For a branch of length (t) with rate matrix (Q), the transition matrix is
The homogeneous scenario uses a shared substitution process across all branches. The heterogeneous scenario changes branch-specific equilibrium compositions so that non-sister taxa (A) and (C) become compositionally convergent.
This design separates two error sources:
- sampling error: two finite alignments differ even under the same model;
- model error: an estimator assumes a substitution process that does not include the generating mechanism.
The same simulated alignment is passed to all four distance estimators. Differences between methods therefore do not come from different random sequences.
Four ways to turn sites into distances
The uncorrected p-distance is the observed mismatch fraction. JC69 corrects multiple substitutions under equal base frequencies and equal rates:
K80 separates transitions (P) from transversions (Q):
Both corrections remain compositionally homogeneous. The regularized log-det distance instead uses the determinant of the (4\times4) joint-frequency matrix (F_{xy}):
Log-det was developed for a broader class of nonstationary Markov processes. Regularization is needed when finite samples make the joint table nearly singular. This extra generality does not make it universally optimal: short alignments can give noisy determinants, and other forms of heterogeneity can still cause failure.
The project implements Neighbor Joining directly. For (n) active taxa or clusters,
and the pair minimizing (Q_{ij}) is joined. For a quartet, recovery reduces to selecting the correct nontrivial split.
When longer alignments converge to different answers
The main experiment uses 120 independently simulated alignments at each of six sequence lengths, from 100 to 5,000 sites. In the homogeneous scenario, all four methods improve with more data. At 5,000 sites, every method recovered the true split in all 120 replicates.
The heterogeneous scenario reverses the pattern for three methods.
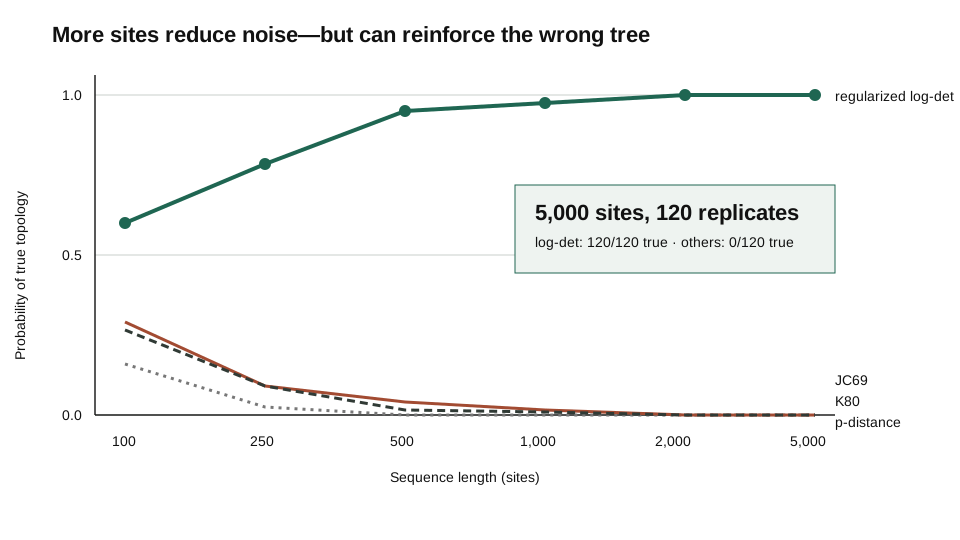
At 100 sites, the true topology was recovered with probabilities (0.158) for p-distance, (0.292) for JC69, (0.267) for K80, and (0.600) for log-det. With increasing length, sampling noise decreased. The three homogeneous distances became more consistent—but around the wrong split (AC\mid BD). By 5,000 sites they selected it in every replicate. Log-det moved in the opposite direction and selected the true split in every replicate.
This result is stronger than “a simple method performs badly.” The wrong answer becomes more reproducible because the estimator converges to distances distorted by compositional convergence.
Complete bootstrap support can still be wrong
Bootstrap analysis resamples alignment columns, rebuilds the tree, and counts how often each split reappears. It measures the stability of the fitted pipeline under site resampling.
The demonstration alignment contains 5,000 sites and uses seed 1729. JC69 and K80 infer (AC\mid BD); log-det infers the true (AB\mid CD). Each method then receives 250 bootstrap replicates.
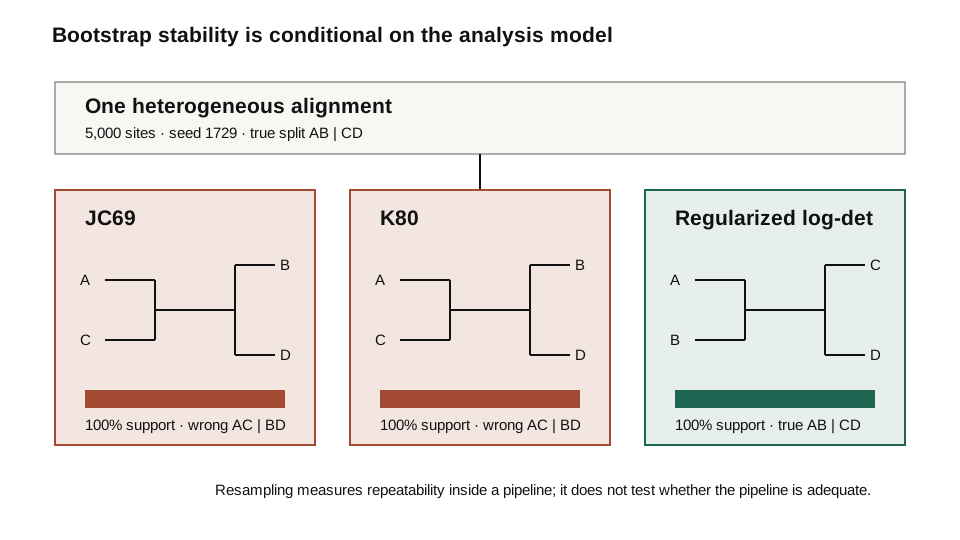
JC69 and K80 gave support (1.000) to the wrong split. Log-det gave support (1.000) to the true split. There is no contradiction: all three analyses are internally stable. They disagree about the mapping from patterns to evolutionary distance.
This is why high support cannot substitute for model checking. Model selection asks which candidate fits best among those considered. Model adequacy asks whether even the selected candidate reproduces important features of the observed data.
What is verified—and what remains open
The supplied computation generated 1,440 main-experiment alignments and 5,760 tree reconstructions, plus 1,000 severity-grid alignments and 750 bootstrap reconstructions. Output validation, 19 required-artifact checks, 44 manifest checksum checks, and six unit tests passed.
The tests verify stochastic transition matrices, zero distance for identical sequences, exact recovery from an additive quartet, deterministic seeds, and finite symmetric distance matrices. They establish computational reproducibility of this synthetic experiment.
They do not show that log-det is always best, that JC69 or K80 are generally useless, or that a quartet captures empirical phylogenomics. The model omits indels, alignment uncertainty, recombination, incomplete lineage sorting, gene-tree discordance, and among-site rate variation.
A stronger next study would fit candidate models and perform parametric adequacy checks on base-composition dispersion and site-pattern counts. It would also compare distance methods with likelihood and Bayesian approaches under larger trees. The most useful extension is analytic: derive the infinite-sequence joint-frequency matrices and show exactly where the four-point inequality changes sign.
Conclusion
Longer sequences answer the question posed by an analysis pipeline more precisely. They do not guarantee that the pipeline poses the right evolutionary question.
The broader modeling lesson extends well beyond phylogenetics: sampling uncertainty can shrink around a biased limit. Confidence should therefore be reported together with the assumptions that define the estimator and evidence that those assumptions can represent the data-generating process.
References
- Jukes, T. H., & Cantor, C. R. (1969). Evolution of protein molecules. In Mammalian Protein Metabolism (Vol. 3, pp. 21–132). https://doi.org/10.1016/B978-1-4832-3211-9.50009-7
- Kimura, M. (1980). A simple method for estimating evolutionary rates of base substitutions through comparative studies of nucleotide sequences. Journal of Molecular Evolution, 16, 111–120. https://doi.org/10.1007/BF01731581
- Saitou, N., & Nei, M. (1987). The Neighbor-Joining method: A new method for reconstructing phylogenetic trees. Molecular Biology and Evolution, 4, 406–425. https://doi.org/10.1093/oxfordjournals.molbev.a040454
- Lake, J. A. (1994). Reconstructing evolutionary trees from DNA and protein sequences: Paralinear distances. Proceedings of the National Academy of Sciences, 91, 1455–1459. https://doi.org/10.1073/pnas.91.4.1455
- Felsenstein, J. (1978). Cases in which parsimony or compatibility methods will be positively misleading. Systematic Zoology, 27, 401–410. https://doi.org/10.1093/sysbio/27.4.401
- Doerr, D., Gronau, I., Moran, S., & Yavneh, I. (2012). Stochastic errors versus modeling errors in distance-based phylogenetic reconstructions. Algorithms for Molecular Biology, 7, 22. https://doi.org/10.1186/1748-7188-7-22
- Ripplinger, J., & Sullivan, J. (2010). Assessment of substitution model adequacy using frequentist and Bayesian methods. Molecular Biology and Evolution, 27, 2790–2803. https://doi.org/10.1093/molbev/msq168