
Cells can separate into domains even when no cell is given a map. One possible explanation is differential adhesion: rearrangements that reduce interfacial energy gradually replace unfavourable contacts with favourable ones. But a rounded cluster is not, by itself, proof of this mechanism. Motility, boundary affinity, kinetic trapping, and the initial arrangement can all change what we see.
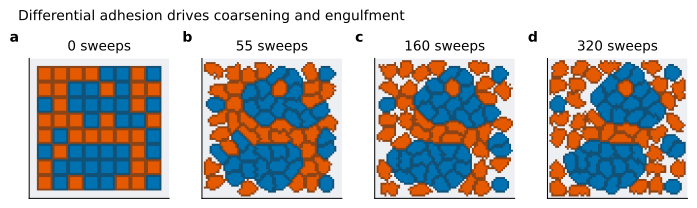
This study treats cell sorting as a model-discrimination problem. A two-dimensional cellular Potts model generates controlled experiments; nine approved figures expose the trajectory, energy budget, parameter regimes, robustness, and competing interpretations. The system is synthetic and represents no named tissue.
A mechanical hypothesis in lattice form
Each cell occupies a connected set of lattice sites with identity and type . The configured Hamiltonian is
The contact energies penalise unlike or unfavourable neighbours; the area and perimeter terms stop cells from disappearing or becoming arbitrarily distorted. A proposed copy is accepted with probability
so the effective temperature controls stochastic rearrangement rather than physical temperature.
For the baseline contact matrix, the effective A–B interfacial tension is
Positive makes heterotypic contacts expensive. The hypothesis is therefore precise: if the dynamics can explore the state space, the system should reduce A–B contact and coarsen into domains.
Measure sorting, do not merely recognise it
The analysis follows heterotypic boundary length, a neighbour-based sorting index, energy, and the fraction of type A cells at the exterior. In the declared run the final sorting index is . This is substantial reorganisation, not perfect segregation.
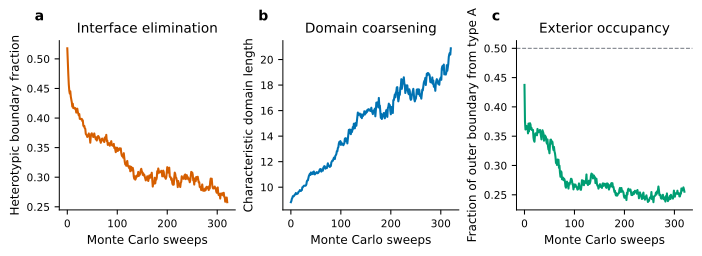
The distinction is important. An image-based conclusion can be dominated by colour choice or cluster size; a scalar index can also hide topology. Keeping several diagnostics prevents either representation from becoming the entire argument.
Adhesion competes with activity
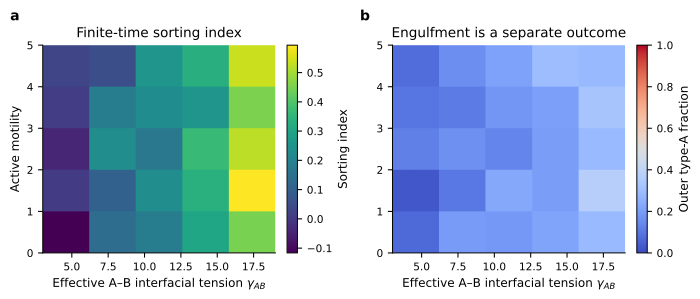
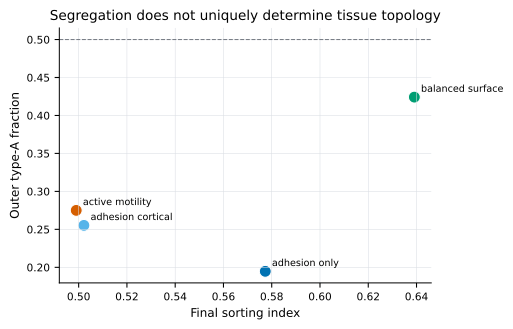
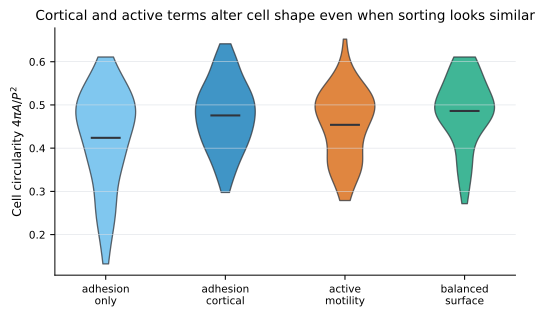
Differential adhesion predicts regimes rather than a universal outcome. The phase scan varies and active motility. Stronger interfacial tension encourages separation; activity can accelerate exploration at moderate levels but can also continually disrupt interfaces.
Two extensions make that competition explicit: persistent motility and altered affinity for the surrounding medium.
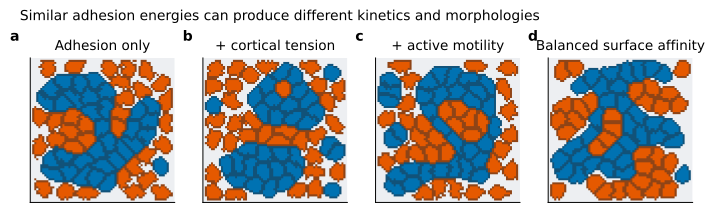
This is where “sorting” and “engulfment” diverge. Sorting measures whether like cells become neighbours. Engulfment asks which population occupies the exterior. A system can score well on one and poorly on the other.
Coarsening carries dynamical information
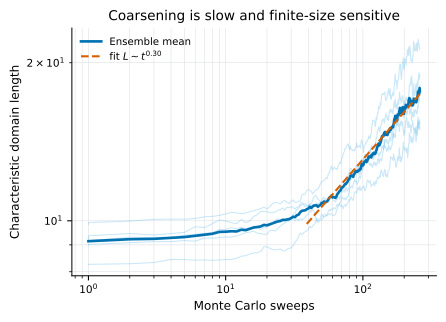
If a characteristic domain size obeys
then summarises how quickly small domains disappear and larger ones grow. Across five configured replicates, the fitted exponent is over the declared fitting window.
Initial conditions test whether the endpoint is inevitable
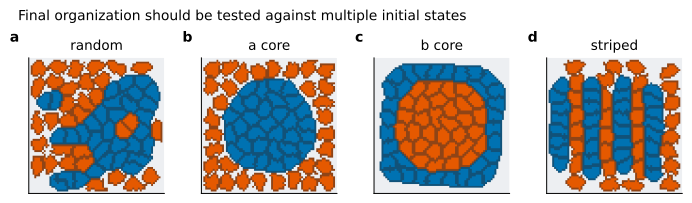
Four starts—random, A-core, B-core, and striped—probe path dependence. If all routes converge, the energy landscape is strongly organising on the simulated timescale. If they do not, metastability is scientifically informative rather than an inconvenience.
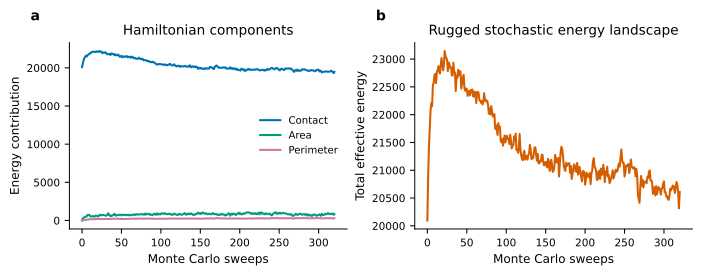
The Hamiltonian can also be decomposed. A fall in contact energy may be offset by area or perimeter penalties, and a visually smooth boundary may be purchased through unrealistic cell distortion.
What the computation supports
The pinned environment passes three automated tests. The complete reproduction regenerates and checksum-validates 35 declared outputs, including all nine figure groups. A second quick run was rebuilt from an empty output directory. Panel labels, legends, long titles, and axis annotations were visually audited; text is black and the palette remains distinguishable without relying on red–green contrast.
The evidence supports a bounded conclusion: differential adhesion can produce sorting in this controlled two-dimensional model, while motility, medium affinity, initial state, and finite simulation time materially affect the observed morphology.
It does not show that adhesion is sufficient in every tissue. Real morphogenesis may involve chemotaxis, polarity, proliferation, extracellular matrix, active stresses, three-dimensional geometry, and time-varying adhesion.
A useful next experiment
The next research step is not simply a larger grid. It is an identifiability test: generate several mechanisms that match the same endpoint, then ask which time-resolved measurements distinguish them. Interface fluctuations, neighbour-exchange rates, radial composition, and shape statistics are promising candidates.
The broader lesson is that a pattern becomes evidence only after we ask what other mechanisms could have drawn it.
References
- Steinberg, M. S. (1963). Reconstruction of tissues by dissociated cells. Journal of Experimental Zoology, 173(4), 395–434. https://doi.org/10.1002/jez.1401730406
- Graner, F., & Glazier, J. A. (1992). Simulation of biological cell sorting using a two-dimensional extended Potts model. Physical Review Letters, 69, 2013–2016. https://doi.org/10.1103/PhysRevLett.69.2013
- Glazier, J. A., & Graner, F. (1993). Simulation of the differential adhesion driven rearrangement of biological cells. Physical Review E, 47, 2128–2154. https://doi.org/10.1103/PhysRevE.47.2128
- Niculescu, I., Textor, J., & de Boer, R. J. (2015). Crawling and gliding: A computational model for shape-driven cell migration. PLoS Computational Biology, 11(10), e1004280. https://doi.org/10.1371/journal.pcbi.1004280
- Durand, M., & Guesnet, E. (2021). An efficient Cellular Potts Model algorithm that forbids cell fragmentation. PLoS Computational Biology, 17(2), e1008576. https://doi.org/10.1371/journal.pcbi.1008576