
A warning system earns its name only if it separates an approaching fault from an inconvenient sensor.
That distinction is easy to blur. Suppose the maximum reported battery temperature rises steadily. The pack may be heating, but the measurement may also be drifting. A threshold cannot tell those stories apart by itself. If the rule fires on almost every biased but physically healthy sequence, its apparent sensitivity is not evidence of safety.
This study starts from a different clue: heat has geometry. Cells in a module exchange heat with physical neighbours. A genuine local thermal event should therefore develop a spatial footprint, while a single drifting channel initially has no supporting evidence around it. The research question is whether that adjacency can help a small sequential detector—not a deep neural network, not a digital twin—issue a useful earlier warning under controlled sensor failures.
The answer from the synthetic benchmark is encouraging but deliberately modest. Under combined sensor drift and dropout, the proposed graph-CUSUM detected 94.4% of faults before the study boundary, compared with 90.0% for independent CUSUM. Its false-alarm rate was slightly higher, 6.25% versus 5.0%, and the intervals overlap. That is a trade-off worth testing further, not a declaration that the problem is solved.
The research claim—and the claim we refuse to make
The precise question is:
Can common-mode removal and graph-neighbour pooling improve warning before a synthetic battery-pack temperature boundary while keeping false alarms near a held-out calibration target?
Every phrase limits the result.
- Common-mode removal means subtracting the median temperature-rate motion shared by active channels.
- Graph-neighbour pooling means combining evidence only between cells that are thermally adjacent in the 4 × 4 pack.
- Synthetic boundary means the first simulated cell reaching 60 °C, used as an evaluation endpoint.
- Held-out calibration means no evaluation trajectory chooses the detector threshold.
The study does not reproduce electrochemical thermal runaway. It does not contain abuse-test measurements, state-of-charge effects, venting, gas release, ageing, cooling-controller dynamics, or propagation between failing cells. The 60 °C line is not offered as a universal battery-safety threshold. It simply defines the deadline in this experiment.
This boundary is central, not a disclaimer added at the end. A numerical model can test whether an algorithm behaves coherently. It cannot certify a battery-management system.
A thermal pack as a graph
The simulated module contains 16 cells arranged on a square grid. Each cell exchanges heat with up to four neighbours. The state equation is a compact energy-balance proxy:
Here, is load-dependent baseline heat, controls cooling toward ambient temperature , and the graph term moves temperature toward the mean of neighbouring cells. The fault term is zero everywhere until the designated onset; it then grows exponentially at one randomly selected cell. Small process noise and measurement noise prevent the experiment from becoming a deterministic pattern-matching exercise.
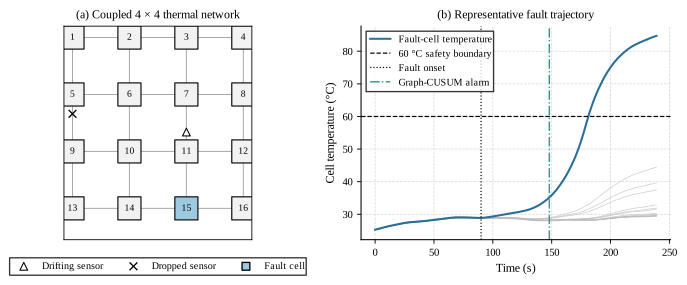
A representative combined-stress run. The graph panel identifies the fault, drifting channel, and missing channel; the trace panel shows the true cell temperatures, fault onset, graph-CUSUM alarm, and study boundary. All figure text is black, while colour and marker shape are redundant data encodings.
The proxy preserves four structures relevant to the detector:
- a slowly changing pack-wide thermal background;
- cell-to-cell variation in heat generation and cooling;
- local fault growth that spreads through physical adjacency; and
- measurement faults that can be isolated to one channel.
It omits far more than it preserves. That is acceptable for an algorithmic pilot if the omissions remain visible and the next experiment is designed to challenge them.
From temperature readings to sequential evidence
The detector does not work directly on absolute temperature. It begins with the first difference
where is the observed temperature. Healthy calibration trajectories supply a robust difference scale through the median absolute deviation. At each time step, the median active-channel motion is removed:
This transformation asks whether one region is accelerating thermally relative to the pack. It also makes the detector less sensitive to smooth ambient or load motion shared across most channels.
Only positive evidence is retained. For cell , local and neighbouring evidence are combined:
A one-sided cumulative sum then evolves as
An alarm occurs when exceeds a threshold selected from healthy calibration trajectories. This is inspired by Page’s CUSUM, but the graph score is a heuristic construction rather than a likelihood-ratio optimum or theorem.
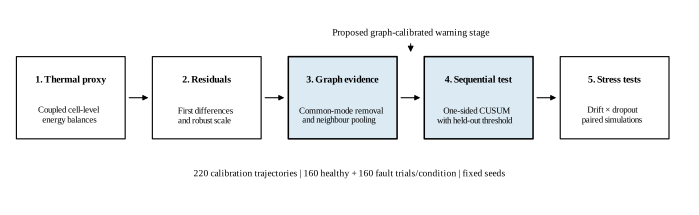
The computational evidence chain. The graph-evidence and sequential-test stages are the proposed combination; the surrounding simulation, calibration, and stress evaluation make the claim auditable.
Calibration before comparison
Detector comparisons become meaningless when each method receives a different chance to overfit. This experiment uses one common calibration protocol:
| Design item | Setting |
|---|---|
| Healthy calibration trajectories | 220 |
| Threshold rule | 95th percentile of whole-trajectory maximum score |
| Evaluation per condition | 160 healthy + 160 faulty trajectories |
| Simulation duration | 240 s at 1 s resolution |
| Fault onset | 90 s |
| Positive drift stress | 0.010 °C s⁻¹ after 55 s |
| Dropout stress | one channel missing after 115 s |
| Evaluation deadline | first true cell at 60 °C |
Calibration and evaluation seed ranges are disjoint. Within an evaluation condition, every method sees the same trajectories. The four principal detectors are:
- a calibrated maximum-temperature threshold;
- an exponentially weighted moving average of positive temperature rate;
- independent per-sensor CUSUM; and
- the proposed common-mode graph-CUSUM.
The primary metric is the probability of alarming after fault onset but before the boundary. A premature alarm on a faulty sequence is not counted as a successful prediction. Healthy-trajectory false-alarm rate is reported separately. Wilson intervals describe proportion uncertainty, and bootstrap intervals describe the median lead time among timely detections.
What the benchmark found
The complete result is easier to read as two questions: how often did each detector warn in time, and how much time remained when it did?
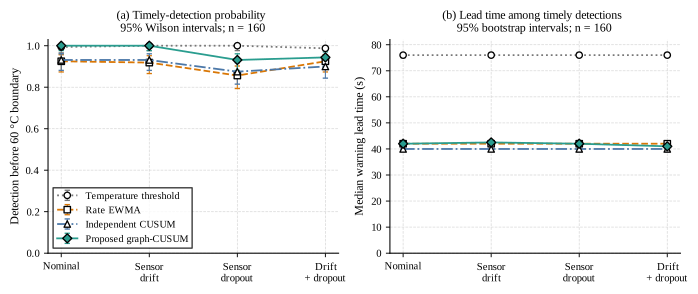
Timely-detection probability and median warning lead time across nominal, drift, dropout, and combined conditions. Error bars are 95% intervals; each point uses 160 trajectories.
Under the designated combined stress, the main values are:
| Detector | Timely detection | Healthy false alarms | Median lead |
|---|---|---|---|
| Temperature threshold | 98.8% | 95.0% | 76 s |
| Rate EWMA | 92.5% | 8.13% | 42 s |
| Independent CUSUM | 90.0% | 5.0% | 40 s |
| Proposed graph-CUSUM | 94.4% | 6.25% | 41 s |
The temperature threshold looks best if only detection and lead time are considered. The false-alarm column changes the interpretation completely. Positive sensor drift pushes the maximum observed temperature across a threshold calibrated on non-drifting data. It alarms on 152 of 160 healthy combined-stress trajectories.
This is not evidence that temperature thresholds are intrinsically poor. Production systems can use sensor diagnostics, voting, persistence rules, multiple thresholds, current and voltage context, or redundant estimation. It is evidence that a nominally calibrated maximum rule is a fragile baseline under the particular bias mechanism represented here.
The comparison between the two CUSUM methods is more informative. Graph-CUSUM improves the combined-stress point estimate for timely detection by 4.4 percentage points and the median lead by one second. Its false-alarm rate rises by 1.25 percentage points. The detection intervals—89.7–97.0% for graph-CUSUM and 84.4–93.8% for independent CUSUM—overlap. A careful summary can report the values, but it should not claim decisive statistical superiority.
What the ablation reveals
A proposed method should not receive credit merely because several operations were bundled together. The ablation calibrates each variant independently, then evaluates the same combined-stress trajectories.
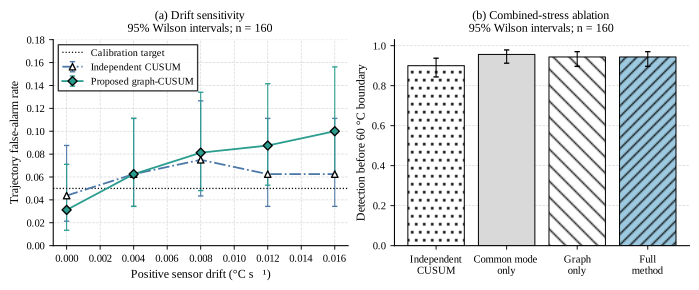
Left: healthy false alarms as positive sensor drift increases. Right: timely detection after removing common-mode correction or graph pooling. Hatches and marker shapes keep the comparisons legible without relying on colour.
The common-mode-only variant produces 95.6% timely detection and a 50-second median lead, but its false-alarm rate increases to 9.4%. The graph-only variant produces 94.4% detection and 7.5% false alarms, but median lead falls to 34 seconds. The full method obtains 94.4%, 6.25%, and 41 seconds.
There is no component that wins every metric. Common-mode correction changes sensitivity to shared motion; neighbour pooling changes how quickly local evidence becomes convincing. The full design occupies a particular trade-off rather than a universally optimal point.
The drift sweep adds another caution. Graph-CUSUM false alarms rise from 3.1% at zero drift to 10.0% at 0.016 °C s⁻¹. Independent CUSUM remains between roughly 4.4% and 7.5% in the same sweep. The graph method retains very high fault detection, but it is not invariant to sensor drift. Calling it “drift-proof” would contradict the data.
Four threats to validity
Construct validity
The endpoint is the first true simulated temperature reaching 60 °C. Real thermal runaway involves electrochemical self-heating, separator and electrolyte behaviour, pressure and gas evolution, venting, and potentially rapid propagation. The experiment measures early warning relative to its own boundary, not real hazard onset.
Internal validity
The detector thresholds use held-out data and the reported seeds are fixed, but the model equations and detector were designed within the same project. A different thermal proxy could favour a different spatial rule. The correct next step is independent data, not another round of tuning on this generator.
External validity
One 4 × 4 geometry cannot represent cylindrical, prismatic, and pouch modules with different cooling plates, busbars, sensor positions, chemistry, ageing, load profiles, or control strategies. The study demonstrates a reproducible mechanism, not broad deployment readiness.
Statistical validity
There are 160 trajectories per class and condition. Wilson and bootstrap intervals make that uncertainty visible, but several comparisons remain unresolved. A future study should preregister the primary metric, define an equivalence or superiority margin, and choose sample size from the effect size worth detecting.
Reproduction and editorial control
The ScienceProject directory is the technical source of truth. Its run.py command regenerates the machine-readable metric tables, calibrated thresholds, summary, and four SVG figures. The public website synchronises only those figures listed under figures/publish/ in the curated manifest.
This article remains manually written. Re-running the experiment can update evidence and approved figures, but it cannot overwrite the interpretation, limitations, or prose. That separation is intentional: computation supplies evidence; editorial review decides what the evidence permits us to say.
Sources and intellectual lineage
The thermal proxy is motivated by the battery energy balance developed by Bernardi, Pawlikowski, and Newman and by the coupled pack model of Guo and White. Temperature-based warning and the gap between internal and external measurements are discussed experimentally by Li and colleagues. The sequential accumulator traces to Page’s original CUSUM paper, while the graph representation follows the signal-processing perspective surveyed by Shuman and colleagues. Experimental comparison of diagnostic timing is represented by Finegan and colleagues.
These sources motivate the model and evaluation question. None validates the numerical results reported here; those values come only from this project’s reproducible synthetic benchmark.
Conclusion
The graph view contributes one useful idea: a local thermal warning should be supported by the neighbourhood in which heat physically moves. In this benchmark, that idea modestly improves timely detection over independent CUSUM under combined drift and dropout, at a small false-alarm cost. It also fails to eliminate drift sensitivity, and its advantage is not statistically decisive across every condition.
That is a useful intermediate outcome. The benchmark shows a modest trade-off, matched baselines, uncertainty bands, an ablation, and explicit counterevidence. The appropriate next sentence is not “the battery is safe.” It is “this idea still needs testing on data that were not used to design the proxy.”