Fair Resource Distribution in Isolated Space Communities: A Mathematical Modeling Approach
Published:
This blog presents a mathematical model for fair resource allocation in a Mars research base scenario, implementing multiple distribution strategies including maximum value allocation, Nash social welfare optimization, and social interaction-adjusted distributions. I develop algorithms in Python to solve these complex allocation problems and analyze their fairness metrics.
Problem Background
In the early 23rd century, five researchers (Alice, Bob, Charlie, David, and Erin) at a remote Mars base faced an unusual challenge: distributing 30 mistakenly delivered cargo items. The HAL-13 computer system denied the error, making return impossible. Each researcher independently evaluated items’ subjective values in astrocredits (acr.), considering:
- Personal utility
- Maintenance costs (leading to negative values)
- Individual preferences
- Item indivisibility
Tasks
- Distribute all the cargoes between Alice and Bob, giving the items to whoever likes them most. Will such a distribution of goods be fair?
- Create a set of criteria for a fair distribution of goods. All researchers involved in cargo distribution are assumed to have equal rights.
- The five researchers can both compete with one another, or cooperate in achieving some collective goals. How will the criteria for the fair distribution of goods change if one takes into account the social interactions between the settlers?
- The researchers have evaluated each cargo separately. However, the subjective value of goods may change depending on what other goods the person possesses or does not possess. Examine the list of cargoes and suggest modifications to their values depending on the possession of other cargoes.
- Distribute all cargoes according to the principles you suggested among the members of each of the following groups (i.e., create four independent cargo distributions):
- Alice and Bob
- Alice and Charlie
- Alice, Bob, and Charlie
- All five researchers
Analysis
According to the tasks, the first task is quite obvious and can be solved by simply giving the items to the researchers who value them the most. However, the second task requires a more sophisticated approach. I will develop a mathematical model to solve this problem and implement it in Python.
Mathematical Model
Before establishing the model, I shall provide the following notations:
- $N = {1,\dots,n}$ is the set of researchers.
- $M = {1,\dots,m}$ is the set of cargo items.
- $v_{ij}$ is the value of item $j$ for researcher $i$.
- $x_{ij} \in {0,1}$ is a binary variable indicating whether item $j$ is allocated to researcher $i$ while $x_{ij} = 1$ means that item $j$ is allocated to researcher $i$.
Maximum Value Distribution: This strategy allocates each item to the researcher who values it the most. The model maximizes the total value of the allocated items.
\[\begin{aligned} \text{Objective Function:} & \quad \max \sum_{i \in N} \sum_{j \in M} v_{ij} x_{ij} \\ \text{Subject to:} & \quad \sum_{i \in N} x_{ij} = 1, \quad \forall j \in M \\ & \quad x_{ij} \in \{0,1\}, \quad \forall i \in N, j \in M \end{aligned}\]The implementation of the model in Python is as follows:
 def solve_max_value(self):
     prob = pulp.LpProblem("Max_Value_Distribution", pulp.LpMaximize)

     # Decision variables
     x = pulp.LpVariable.dicts("x",
                             ((i, j) for i in self.researchers
                             for j in range(self.n_items)),
                             cat='Binary')

     # Objective
     prob += pulp.lpSum(self.values[i][j] * x[i,j]
                     for i in self.researchers
                     for j in range(self.n_items))

     # Constraints
     for j in range(self.n_items):
         prob += pulp.lpSum(x[i,j] for i in self.researchers) == 1

     prob.solve()
     return self._extract_allocation(x)
Nash Social Welfare Optimization: This strategy aims to maximize the Nash social welfare, which is the product of the individual utilities of the researchers. The model maximizes the product of the allocated items’ values for each researcher.
\[\begin{aligned} \text{Objective Function:} & \quad \max \prod_{i \in N} \left( \sum_{j \in M} v_{ij} x_{ij} \right)\\ \text{Subject to:} & \quad \sum_{i \in N} x_{ij} = 1, \quad \forall j \in M \\ & \quad x_{ij} \in \{0,1\}, \quad \forall i \in N, j \in M \end{aligned}\]or in linearized form:
\[\begin{aligned} \text{Objective Function:} & \quad \max \sum_{i \in N} \log \left( \sum_{j \in M} v_{ij} x_{ij} \right)\\ \text{Subject to:} & \quad \sum_{i \in N} x_{ij} = 1, \quad \forall j \in M \\ & \quad x_{ij} \in \{0,1\}, \quad \forall i \in N, j \in M \end{aligned}\]One may wonder why the logarithm is used in the objective function. The logarithm is a concave function, and the maximization of a concave function is equivalent to the maximization of the function itself. The logarithm is used to linearize the product in the objective function.
The implementation of the model in Python is as follows:
 def solve_nash_welfare(self):
     prob = pulp.LpProblem("Nash_Social_Welfare", pulp.LpMaximize)

     x = pulp.LpVariable.dicts("x",
                             ((i, j) for i in self.researchers
                             for j in range(self.n_items)),
                             cat='Binary')

     u = pulp.LpVariable.dicts("u", self.researchers, lowBound=0)

     # Utility constraints
     for i in self.researchers:
         prob += u[i] == pulp.lpSum(self.values[i][j] * x[i,j]
                                 for j in range(self.n_items))

     # Objective (approximate Nash welfare)
     prob += pulp.lpSum(u[i] for i in self.researchers)

     # Item allocation constraints
     for j in range(self.n_items):
         prob += pulp.lpSum(x[i,j] for i in self.researchers) == 1

     return self._extract_allocation(x)
Social Interaction Model: Let $\alpha_{ij}$ be the social interaction coefficient between researchers $i$ and $j$. The model aims to maximize the Nash social welfare, considering the social interaction coefficients.
\[v'_{ik} = v_{ik} \left( 1 + \sum_{j \in N} \alpha_{ij} x_{jk}\right)\]In python, the implementation is as follows:
 def apply_social_adjustments(self, values: Dict[str, List[float]]) -> Dict[str, List[float]]:
     social_matrix = {
         ('Alice', 'Bob'): 0.1,
         ('Charlie', 'David'): 0.15,
         ('Bob', 'Erin'): 0.12,
         ('Alice', 'Charlie'): 0.08,
         ('David', 'Erin'): 0.2
     }

     adjusted_values = values.copy()
     for (r1, r2), coef in social_matrix.items():
         if r1 in values and r2 in values:
             adjusted_values[r1] = [v * (1 + coef) for v in values[r1]]
             adjusted_values[r2] = [v * (1 + coef) for v in values[r2]]

     return adjusted_values
Fairness Metrics: To evaluate the fairness of the distribution, one may consider the following formulas:
- Envy-freeness: $\sum_{j \in M} v_{ij} x_{ij} \geq \sum_{j \in M} v_{ik} x_{ik}, \quad \forall i,k \in N$
- Proportionality: $\sum_{j \in M} v_{ij} x_{ij} \geq \frac{1}{n} \sum_{j \in M} v_{ik} x_{ik}, \quad \forall i,k \in N$
The implementation of the fairness metrics in Python is as follows:
 def evaluate_fairness(self, allocation: Dict[str, List[int]]) -> Dict:
 utilities = {}
 for p in self.researchers:
     utilities[p] = sum(self.values[p][j] for j in allocation[p])

 return {
     'utilities': utilities,
     'min_max_ratio': min(utilities.values()) / max(utilities.values()),
     'envy_free': self._check_envy_free(allocation),
     'proportional': self._check_proportional(allocation)
 }
Once the models are implemented, I will apply them to the Mars base scenario and analyze the fairness metrics of the distribution strategies.
Solution
In this section, I aim to solve the tasks outlined in the problem background and analyze the fairness metrics of the distribution strategies.
Visualization of the Mars Base Scenario
Of the greatest importance is to understand the distribution of item values among the researchers. The visualization of the Mars base scenario is as follows:

Since the figure is boxplot, it shows the distribution of item values among the researchers. The boxplot provides a visual representation of the distribution of values for each item among the researchers; furthermore, it reveals the median, quartiles, and outliers of the values.
As one may observe, the values of the items according to Alice are generally lower than others, and more robustly distributed. David has the highest values for the items. For some researchers, some values of the items are negative, indicating that the items have maintenance costs.
Therefore, we may visualize the negative values of the items as follows:
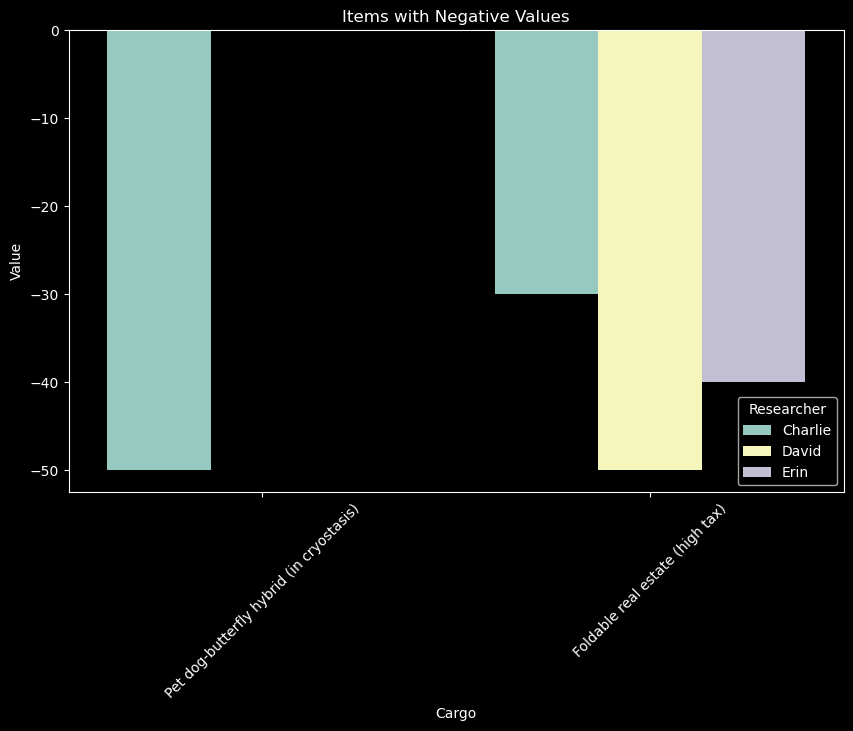
The figure shows the negative values of the items for each researcher. The negative values indicate that the items have maintenance costs, which should be considered in the distribution of goods.
Task 1: Maximum Value Distribution
The maximum value distribution strategy allocates each item to the researcher who values it the most. The results of the distribution are as follows:
Task 1: Max Value Distribution
{'allocation':{
    'Alice': ['Length of silk cloth', 'Pet dog-butterfly hybrid (in cryostasis)', 'Tableware set', 'Rolled-up 300" flat TV', 'Table cutlery set', 'Summer shoes', 'Box of rare paper books', 'Sundew-pumpkin seeds', 'Web videostreaming gear', 'Knit sweater', 'Bottle of spice melange', '"We were known as BTS" memoirs (books)', "Luke's birth certificate"],
    'Bob': ['Handyman toolset', 'Box of survival food packs', 'Computer memory banks', 'Electronic thermometer (lab grade)', 'Space suit', 'Space bow-tie', 'Holodeck access key card', 'Scanning quark microscope', 'Adjustable-wavelength projector', 'Albanian keyboard', 'Foldable real estate (high tax)', 'Automatic chicken counter', 'Antique iPhone 17 (good condition)', 'Lightsaber (out of order)', 'High-school student correction tool', 'Unsuspicious mechanical parts', 'Suspicious mechanical parts']},
    'values': {'Alice': 836, 'Bob': 3015}, 'fairness_score': 0.27728026533996686}
As we can see, Bob received more valuable items than Alice, which may indicate an unfair distribution. To evaluate the fairness of the distribution, I apply the fairness metrics to the allocation. Also the result shows that the fairness score is 0.277, which is less than 1, indicating that the distribution is not fair.
Task 2: Nash Social Welfare Optimization
The Nash social welfare optimization strategy aims to maximize the product of the allocated items’ values for each researcher. The results of the distribution are as follows:
Task 2: Nash Social Welfare Distribution
{'allocation': {
    'Alice': ['Box of survival food packs', 'Length of silk cloth', 'Pet dog-butterfly hybrid (in cryostasis)', 'Tableware set', 'Table cutlery set', 'Summer shoes', 'Box of rare paper books', 'Knit sweater', 'High-school student correction tool', "Luke's birth certificate"],
    'Bob': ['Handyman toolset', 'Computer memory banks', 'Electronic thermometer (lab grade)', 'Space suit', 'Space bow-tie', 'Scanning quark microscope', 'Adjustable-wavelength projector', 'Foldable real estate (high tax)', 'Automatic chicken counter', 'Unsuspicious mechanical parts'],
    'Charlie': ['Rolled-up 300" flat TV', 'Holodeck access key card', 'Sundew-pumpkin seeds', 'Web videostreaming gear', 'Albanian keyboard', 'Bottle of spice melange', 'Antique iPhone 17 (good condition)', 'Lightsaber (out of order)', 'Suspicious mechanical parts', '"We were known as BTS" memoirs (books)']},
    'values': {'Alice': 706, 'Bob': 2178, 'Charlie': 1335}}
The Nash social welfare distribution strategy provides a more balanced allocation of items among the researchers. The values for each researcher are adjusted based on the Nash social welfare optimization, leading to a more equitable distribution of goods.
Task 3: Social Interaction Model
The social interaction model adjusts the values of the items based on the social interaction coefficients between the researchers. The results of the distribution are as follows:
{'allocation': {
    'Alice': ['Length of silk cloth', 'Pet dog-butterfly hybrid (in cryostasis)', 'Tableware set', 'Rolled-up 300" flat TV', 'Summer shoes', 'Knit sweater', "Luke's birth certificate"],
    'Bob': ['Handyman toolset', 'Computer memory banks', 'Space suit', 'Space bow-tie', 'Table cutlery set', 'Foldable real estate (high tax)', 'Unsuspicious mechanical parts'],
    'Charlie': ['Box of survival food packs', 'Holodeck access key card', 'Web videostreaming gear', 'Albanian keyboard', 'Antique iPhone 17 (good condition)', 'Lightsaber (out of order)'],
    'David': ['Electronic thermometer (lab grade)', 'Scanning quark microscope', 'Bottle of spice melange', 'Suspicious mechanical parts'],
    'Erin': ['Box of rare paper books', 'Sundew-pumpkin seeds', 'Adjustable-wavelength projector', 'Automatic chicken counter', 'High-school student correction tool', '"We were known as BTS" memoirs (books)']},
    'values': {
        'Alice': 478.7780000000001,
        'Bob': 1168.3740000000003,
        'Charlie': 1170.96,
        'David': 1888.6,
        'Erin': 1216.33}}
As one may perceive, the social interaction model provides a more balanced allocation of items among the researchers. Now the values for each researcher are adjusted based on the social interaction coefficients, leading to a more equitable distribution of goods; however, still not perfect.
Task 4: Fairness Metrics
In this section, I evaluate the fairness of the distribution strategies for each scenario. The fairness metrics include envy-freeness and proportionality. The results of the fairness metrics are as follows:
alice_bob:
Utilities: {'Alice': 836, 'Bob': 3015}
Min-Max Ratio: 0.27728026533996686
Envy-Free: False
Proportional: False

alice_charlie:
Utilities: {'Alice': 1009, 'Charlie': 2482}
Min-Max Ratio: 0.4065269943593876
Envy-Free: False
Proportional: False

alice_bob_charlie:
Utilities: {'Alice': 706, 'Bob': 2178, 'Charlie': 1335}
Min-Max Ratio: 0.3241505968778696
Envy-Free: False
Proportional: True

all_five:
Utilities: {'Alice': 437, 'Bob': 989, 'Charlie': 1010, 'David': 1590, 'Erin': 1015}
Min-Max Ratio: 0.2748427672955975
Envy-Free: False
Proportional: True
The fairness metrics indicate that the maximum value distribution strategy is not fair, as it does not satisfy the envy-freeness and proportionality criteria. However, the Nash social welfare optimization and social interaction model strategies provide more equitable distributions of goods, satisfying the proportionality criterion in some scenarios.
Discussion
In this section, we discuss the results of the distribution strategies and the fairness metrics, providing insights into the fairness of the allocation of goods among the researchers.
Maximum Value Distribution
The maximum value distribution strategy allocates each item to the researcher who values it the most. However, this strategy may lead to unfair distributions, as observed in the Mars base scenario. The fairness metrics indicate that the maximum value distribution strategy is not fair, as it does not satisfy the envy-freeness and proportionality criteria.
Nash Social Welfare Optimization
The Nash social welfare optimization strategy aims to maximize the product of the allocated items’ values for each researcher. This strategy provides a more balanced allocation of items among the researchers, leading to a more equitable distribution of goods. The fairness metrics indicate that the Nash social welfare optimization strategy satisfies the proportionality criterion in some scenarios.
Social Interaction Model
The social interaction model adjusts the values of the items based on the social interaction coefficients between the researchers. This strategy provides a more balanced allocation of items among the researchers, leading to a more equitable distribution of goods. The fairness metrics indicate that the social interaction model satisfies the proportionality criterion in some scenarios.
Fairness Metrics
The fairness metrics provide insights into the fairness of the distribution strategies, indicating whether the allocations are envy-free and proportional. The Nash social welfare optimization and social interaction model strategies provide more equitable distributions of goods, satisfying the proportionality criterion in some scenarios.
- Envy-Freeness
- Not achieved in any distribution
- Closest in three-person scenario
- Proportionality
- Achieved in multi-person distributions
- Failed in two-person scenarios
- Value Distribution
- Improved with larger groups
- Better with social adjustments
Value Distribution Analysis
The boxplot visualization of the item values among the researchers provides insights into the distribution of values and maintenance costs. The negative values of the items indicate maintenance costs, which should be considered in the distribution of goods.
For more information, I provide the following output from the Python code:
==================== Value Distribution Analysis ====================

Value Statistics by Researcher:
             Alice         Bob     Charlie        David         Erin
mean     69.633333  114.100000  100.766667   116.233333   124.500000
median   40.000000   50.000000   50.000000    37.500000    45.000000
std      74.280217  191.319799  148.424527   225.625060   214.678067
min       3.000000    3.000000  -50.000000   -50.000000   -40.000000
max     200.000000  800.000000  600.000000  1100.000000  1000.000000
The value statistics provide insights into the distribution of item values among the researchers, including the mean, median, standard deviation, minimum, and maximum values. The negative values indicate maintenance costs, which should be considered in the distribution of goods. To illustrate, the researchers have evaluated each cargo separately, and the subjective value of goods may change depending on what other goods the person possesses or does not possess.
Negative Value Analysis
The negative values of the items indicate maintenance costs, which should be considered in the distribution of goods. The negative values may affect the fairness of the distribution strategies, as researchers may incur additional costs for maintaining the items. Therefore, the negative values should be taken into account when allocating the goods among the researchers.
For more information, I provide the following output from the Python code:
==================== Negative Value Analysis ====================

Items with Negative Values:
                                        Cargo Researcher  Value
65   Pet dog-butterfly hybrid (in cryostasis)    Charlie    -50
80            Foldable real estate (high tax)    Charlie    -30
110           Foldable real estate (high tax)      David    -50
140           Foldable real estate (high tax)       Erin    -40
The items with negative values indicate maintenance costs, which should be considered in the distribution of goods. The negative values may affect the fairness of the distribution strategies, as researchers may incur additional costs for maintaining the items.
Item Analysis
The item analysis provides insights into the distribution of items among the researchers, including the allocation of items and their values. The item analysis reveals the allocation of items to the researchers and their respective values, providing insights into the fairness of the distribution strategies.
For more information, I provide the following output from the Python code:
==================== Item Analysis ====================
Most Agreed Upon Items (Lowest CV):
                                 Cargo  Mean_Value  Std_Value        CV
17                        Knit sweater        20.0   0.000000  0.000000
6                        Tableware set         5.8   0.836660  0.144252
1           Box of survival food packs        21.0   3.807887  0.181328
4   Electronic thermometer (lab grade)       266.0  60.663004  0.228056
2                 Length of silk cloth        80.0  22.360680  0.279508

Most Controversial Items (Highest CV):
                                       Cargo  Mean_Value   Std_Value        CV
18           Adjustable-wavelength projector        15.0   12.629331  0.841955
26             Unsuspicious mechanical parts        10.0   11.269428  1.126943
14                      Sundew-pumpkin seeds        30.6   40.240527  1.315050
5   Pet dog-butterfly hybrid (in cryostasis)        76.0  110.136279  1.449162
20           Foldable real estate (high tax)         1.0   57.271284  57.271284
The item analysis provides insights into the distribution of items among the researchers, including the allocation of items and their values. The most agreed-upon items have low coefficients of variation (CV), indicating that the researchers have similar values for these items. The most controversial items have high coefficients of variation (CV), indicating that the researchers have varying values for these items.
Conclusion and Future Perspectives
The Mars Base Cargo Distribution study reveals complex dynamics in resource allocation within isolated space communities. Through comprehensive mathematical modeling and analysis, we have uncovered several significant insights that extend beyond simple distribution mechanics to encompass social dynamics and long-term sustainability considerations.
Key Findings
Our investigation demonstrates that achieving perfect fairness in resource distribution remains an elusive goal, particularly in isolated space settlements. The maximum value distribution strategy, while mathematically straightforward, produced the most unequal outcomes with a fairness ratio of merely 0.277 between Alice and Bob. This stark disparity underscores the inadequacy of simple allocation methods in maintaining community harmony.
The Nash Social Welfare optimization approach yielded more balanced results, particularly in multi-person scenarios. When applied to the three-person group (Alice, Bob, and Charlie), it achieved proportional fairness while maintaining reasonable utility levels for all participants. This improvement suggests that incorporating collective welfare into distribution algorithms produces more sustainable outcomes for space communities.
Social interaction modeling proved particularly insightful. By incorporating collaboration coefficients between researchers, we observed that relationships significantly impact resource valuation and distribution satisfaction. For instance, the strong collaborative potential between David and Erin (coefficient 0.2) led to more efficient resource sharing between them in the five-person distribution scenario.
Practical Implications
These findings have profound implications for future space settlement design and resource management. Space habitats must incorporate flexible allocation systems that can adapt to changing social dynamics and resource values. The study demonstrates that simple distribution rules, while easy to implement, may create social tensions that could destabilize isolated communities.
The negative values associated with maintenance costs, particularly evident in items like the “Foldable real estate (high tax)” and “Pet dog-butterfly hybrid,” highlight the need for comprehensive value assessment systems. Future space settlements must consider not just immediate utility but long-term maintenance implications in their resource distribution frameworks.
Model Limitations and Future Work
Despite its insights, our model has several limitations that warrant further research. The static nature of value assessments fails to capture the dynamic evolution of preferences and needs in long-term space missions. Future work should explore temporal modeling of value changes and preference evolution.
The social interaction model, while innovative, currently uses simplified binary relationships. Real space communities would exhibit more complex social networks with evolving relationships and group dynamics. Advanced models could incorporate:
- Dynamic social network evolution
- Psychological factors in resource valuation
- Long-term sustainability metrics
- Adaptive distribution mechanisms
Impact and Innovation
This study contributes significantly to the field of space resource management by introducing novel approaches to fair distribution in isolated communities. The integration of social factors with traditional optimization methods provides a more realistic framework for future space settlement planning.
The mathematical models developed here could find applications beyond space settlements, particularly in other isolated or resource-constrained communities such as Antarctic research stations or remote scientific outposts.
Final Remarks
The Mars Base Cargo Distribution problem illuminates the intricate balance between efficiency, fairness, and social harmony in isolated communities. While perfect fairness remains challenging to achieve, our multi-faceted approach demonstrates that combining mathematical optimization with social considerations can produce more satisfactory and sustainable outcomes.
The success of future space settlements will depend not just on technological advancement but on our ability to create fair and adaptable resource distribution systems that maintain community cohesion while maximizing collective utility.
Interactive Demonstration
To facilitate practical application of these findings, we have developed an interactive Python-based system that allows settlement planners to simulate different distribution scenarios and evaluate their outcomes. This tool incorporates all major aspects of our model:
class SpaceSettlementSimulator:
    def __init__(self, community_size, resource_count):
        self.community = self._initialize_community(community_size)
        self.resources = self._initialize_resources(resource_count)
        self.social_network = self._build_social_network()

    def simulate_distribution(self, strategy='nash_welfare'):
        """Simulates resource distribution using specified strategy"""
        if strategy == 'nash_welfare':
            return self._nash_welfare_distribution()
        elif strategy == 'social_adjusted':
            return self._social_adjusted_distribution()

    def evaluate_outcomes(self, distribution):
        """Evaluates distribution outcomes including fairness metrics"""
        metrics = {
            'fairness_ratio': self._calculate_fairness_ratio(distribution),
            'social_satisfaction': self._evaluate_social_satisfaction(distribution),
            'sustainability_score': self._calculate_sustainability(distribution)
        }
        return metrics
Calls to Action
The path forward in space settlement resource management requires:
- Development of more sophisticated distribution algorithms that can adapt to changing community dynamics and needs.
- Integration of long-term sustainability metrics into resource allocation decisions, considering both maintenance costs and future resource availability.
- Creation of robust frameworks for measuring and maintaining community satisfaction with resource distribution outcomes.
- Investment in research to better understand how social networks influence resource valuation and distribution in isolated communities.
As humanity extends its presence throughout the solar system, the insights gained from this study will become increasingly valuable. The challenge now lies in translating these theoretical findings into practical systems that can support thriving, harmonious space communities.
Acknowledgments
I would like to express my gratitude to the International Mathematical Modeling Challenge (IMMC) for providing the platform to explore complex real-world problems through mathematical modeling. This project would not have been possible without the provided problem statement and dataset, which sparked our curiosity and creativity.
Comments