Darts Simulation
Published:
This post is established based on the project I have read on the book “A First Course in Mathematical Modeling” by Frank R. Giordano et al. The project is about simulating the game of darts.
Darts Simulation
Darts-Construct and perform a Monte Carlo simulation of a dars game. The rules are
| Dart board area | Points |
|---|---|
| Bull’s eye | 50 |
| Yellow ring | 25 |
| Blue ring | 15 |
| Red ring | 10 |
| White ring | 5 |
From the origin (the center of the bullseye), the radius of each ring is as follows:
| Ring | Thickness(in.) | Distance to outer ring edge from the origin (in.) |
|---|---|---|
| Bull’s eye | 1.0 | 1.0 |
| Yellow ring | 1.5 | 2.5 |
| Blue ring | 2.5 | 5.0 |
| Red ring | 3.0 | 8.0 |
| White ring | 4.0 | 12.0 |
The board has a radius of $1$ ft($12$ in.).
Make an assumption about the distribution of how the darts hit on the board. Write an algorithm, and code it in the computer language of your choice. Run $1000$ simulations to dtermine the mean score for throwing five darts. Also, determine which ring has the highest expected value (point value times the probability of hitting that ring).
Solution
First we import the necessary libraries and define the constants.
import numpy as np
import matplotlib.pyplot as plt
Then we set up the parameters of the matplotlib library.
import matplotlib
matplotlib.rcParams.update({'font.family': 'serif', 'font.size': 16})
Though we use Monte Carlo simulation, we need to set the random seed to make the results reproducible.
np.random.seed(23) # Set the random seed
After that, we define the parameters of the dart board.
# Constants
BULLSEYE_RADIUS = 1.0
YELLOW_RADIUS = 2.5
BLUE_RADIUS = 5.0
RED_RADIUS = 8.0
WHITE_RADIUS = 12.0
As well as the points of each ring.
# Points for each ring
POINTS = {
    "Bull's eye": 50,
    "Yellow ring": 25,
    "Blue ring": 15,
    "Red ring": 10,
    "White ring": 5,
    "Miss": 0
}
We define the function throw_dart to simulate the throw of a dart.
def throw_dart(std_dev):
    """Simulate throwing a dart"""
    x = np.random.normal(0, std_dev)
    y = np.random.normal(0, std_dev)
    return x, y, np.sqrt(x**2 + y**2)
We set up some rules to determine the score of the dart.
def score_throw(distance):
    """Score a throw based on its distance from the center"""
    if distance <= BULLSEYE_RADIUS:
        return POINTS["Bull's eye"]
    elif distance <= YELLOW_RADIUS:
        return POINTS["Yellow ring"]
    elif distance <= BLUE_RADIUS:
        return POINTS["Blue ring"]
    elif distance <= RED_RADIUS:
        return POINTS["Red ring"]
    elif distance <= WHITE_RADIUS:
        return POINTS["White ring"]
    else:
        return POINTS["Miss"]
Furthermore, we define the function simulate_game to simulate the game.
def run_simulation(num_simulations, num_darts, std_dev):
    """Run the Monte Carlo simulation"""
    total_scores = []
    ring_hits = {ring: 0 for ring in POINTS.keys()}
    all_throws = []

    for _ in range(num_simulations):
        game_score = 0
        for _ in range(num_darts):
            x, y, distance = throw_dart(std_dev)
            score = score_throw(distance)
            game_score += score
            all_throws.append((x, y))

            # Count ring hits
            for ring, radius in zip(["Bull's eye", "Yellow ring", "Blue ring", "Red ring", "White ring"],
                                    [BULLSEYE_RADIUS, YELLOW_RADIUS, BLUE_RADIUS, RED_RADIUS, WHITE_RADIUS]):
                if distance <= radius:
                    ring_hits[ring] += 1
                    break
            else:
                ring_hits["Miss"] += 1

        total_scores.append(game_score)

    return total_scores, ring_hits, all_throws
For the simulation, I love to plot the dartboard to visualize the results.
def plot_dartboard(all_throws):
    fig, (ax1, ax2) = plt.subplots(1, 2, figsize=(20, 10))

    # Plot dartboard
    radii = [BULLSEYE_RADIUS, YELLOW_RADIUS, BLUE_RADIUS, RED_RADIUS, WHITE_RADIUS]
    colors = ['red', 'yellow', 'blue', 'red', 'white']

    for radius, color in zip(radii, colors):
        circle = plt.Circle((0, 0), radius, fill=False, color=color)
        ax1.add_artist(circle)

    # Plot throws
    x, y = zip(*all_throws)
    # Setting background color to black
    ax1.set_facecolor('black')
    ax1.scatter(x, y, color='green', s=1, alpha=0.8)

    ax1.set_xlim(-12.5, 12.5)
    ax1.set_ylim(-12.5, 12.5)
    ax1.set_aspect('equal')
    ax1.legend(["Bull's eye", "Yellow ring", "Blue ring", "Red ring", "White ring"])
    ax1.set_title("Simulated Dart Throws")

    # Plot histogram
    ax2.hist(scores, bins=30, edgecolor='black')
    ax2.set_title(f"Distribution of Scores for {num_darts} Darts")
    ax2.set_xlabel("Score")
    ax2.set_ylabel("Frequency")

    plt.tight_layout()
    plt.show()
Finally, we run the simulation.
# Run the simulation
num_simulations = 1000
num_darts = 5
std_dev = 3  # standard deviation of the throw

scores, ring_hits, all_throws = run_simulation(num_simulations, num_darts, std_dev)
And we calculate the results.
# Calculate results
mean_score = np.mean(scores)
total_throws = num_simulations * num_darts

print(f"Mean score for {num_darts} darts: {mean_score:.2f}")
print("\nProbability of hitting each ring:")
for ring, hits in ring_hits.items():
    prob = hits / total_throws
    expected_value = POINTS[ring] * prob
    print(f"{ring}: {prob:.4f} (Expected value: {expected_value:.2f})")
The output is as follows:
Mean score for 5 darts: 89.45

Probability of hitting each ring:
Bull's eye: 0.0566 (Expected value: 2.83)
Yellow ring: 0.2302 (Expected value: 5.75)
Blue ring: 0.4632 (Expected value: 6.95)
Red ring: 0.2220 (Expected value: 2.22)
White ring: 0.0274 (Expected value: 0.14)
Miss: 0.0006 (Expected value: 0.00)
We also find the highest expected value.
# Find ring with highest expected value
best_ring = max(ring_hits.keys(), key=lambda x: POINTS[x] * ring_hits[x] / total_throws)
print(f"\nRing with highest expected value: {best_ring}")
The output is as follows:
Ring with highest expected value: Blue ring
Finally, we plot the dartboard.
# Plot dartboard and histogram
plot_dartboard(all_throws)
We have the following plot:
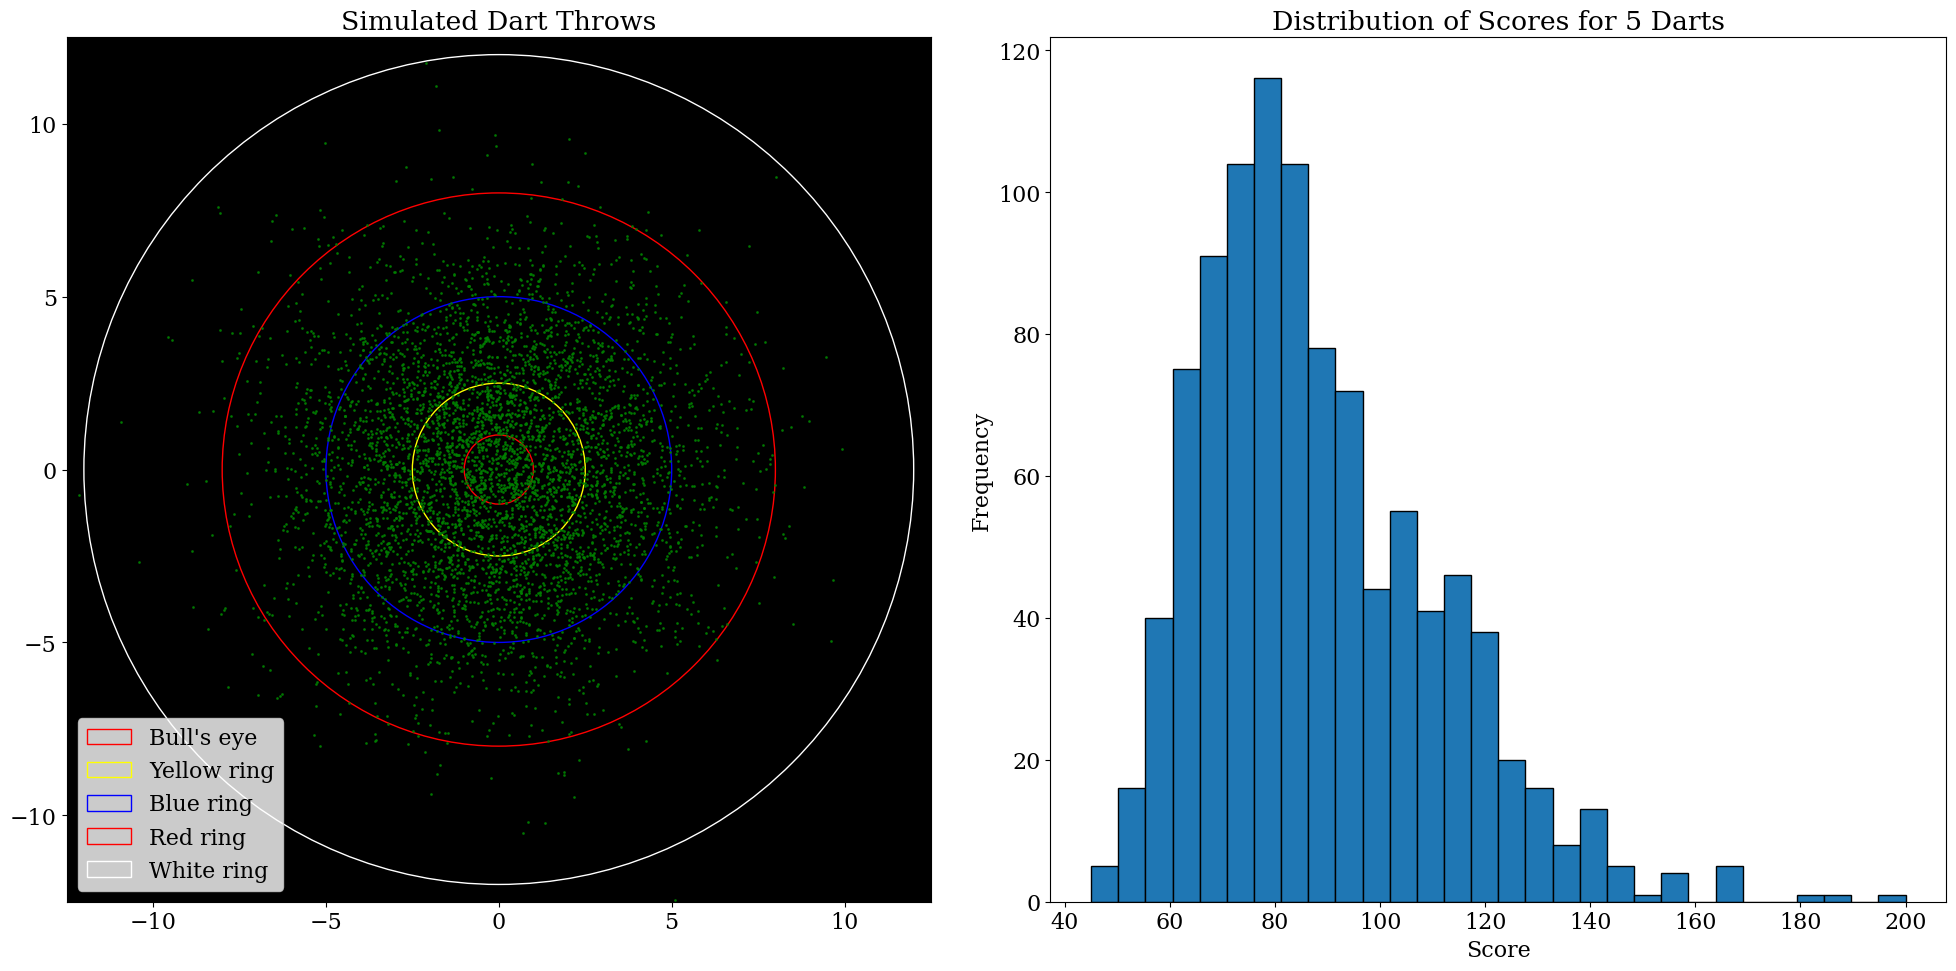
Results and Discussion
The simulation results show that the mean score for throwing five darts is $89.45$. The probability of hitting each ring is as follows:
- Bull’s eye: $0.0566$ (Expected value: $2.83$)
- Yellow ring: $0.2302$ (Expected value: $5.75$)
- Blue ring: $0.4632$ (Expected value: $6.95$)
- Red ring: $0.2220$ (Expected value: $2.22$)
- White ring: $0.0274$ (Expected value: $0.14$)
- Miss: $0.0006$ (Expected value: $0.00$)
- The ring with the highest expected value is the Blue ring.
The simulation results are consistent with the expected values based on the point values and the probability of hitting each ring.
The plot of the dartboard shows the distribution of the dart throws. The majority of the throws are in the Blue ring, which has the highest expected value.
Conclusion
In this post, we have simulated the game of darts using a Monte Carlo simulation. The results show that the mean score for throwing five darts is $89.45$. The probability of hitting each ring is consistent with the expected values based on the point values and the probability of hitting each ring. The ring with the highest expected value is the Blue ring. The plot of the dartboard shows the distribution of the dart throws, with the majority of the throws in the Blue ring.
Comments